The 2026 pallet market demonstrates continued price growth across all grades, following the stabilization period of 2023-2024. Our comprehensive analysis of 396 verified supplier listings across all 50 states reveals significant year-over-year increases driven by rising lumber costs, transportation expenses, and consolidation in the pallet industry.
📅 Data Note: This report reflects Q1 2026 pricing data (January-February 2026). We continuously monitor market conditions and will update this report throughout the year as new data becomes available. Last updated: February 2026.
Data Collection: January-February 2026 | Sample Size: 396 verified suppliers | Pallet Specifications: Standard 48×40 GMA pallets
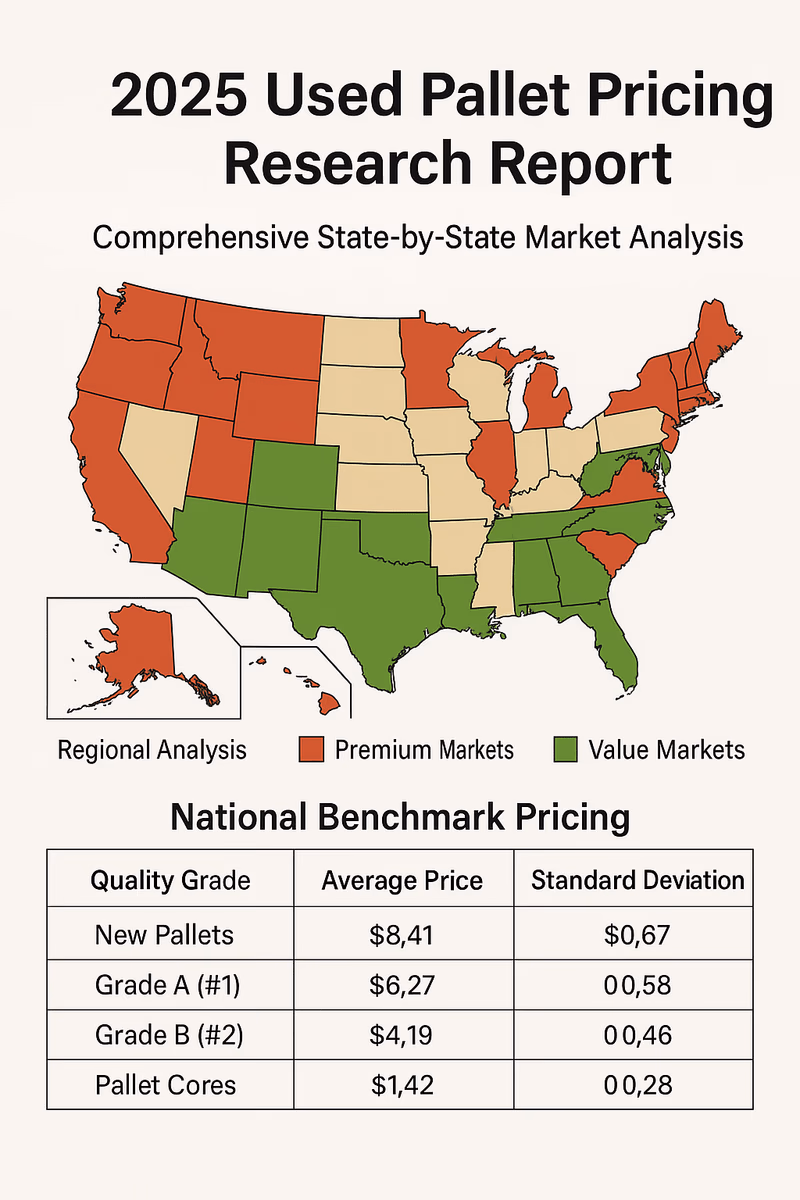
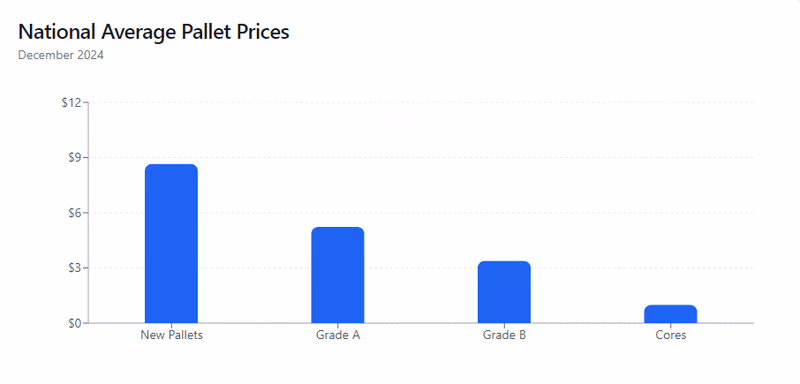
National Benchmark Pricing 2026
Grade A Pallets (Premium Quality)
2026: Average $9.04 | Median $7.91 | Range $4.62-$24.00
| Year | Average | Change |
|---|---|---|
| 2023 | $5.86 | — |
| 2024 | $6.16 | +5.1% |
| 2025 | $8.33 | +35.2% |
| 2026 | $9.04 | +8.5% |
| 3-Year | — | +54.3% |
Grade A prices have increased significantly as demand for premium pallets continues to outpace supply in many markets. The +54.3% increase since 2023 reflects both market recovery from post-pandemic lows and consolidation effects.
Grade B Pallets (Standard Quality)
2026: Average $6.82 | Median $5.79 | Range $3.63-$16.80
| Year | Average | Change |
|---|---|---|
| 2023 | $3.79 | — |
| 2024 | $4.14 | +9.2% |
| 2025 | $6.24 | +50.7% |
| 2026 | $6.82 | +9.3% |
| 3-Year | — | +79.9% |
Grade B pallets show strong growth, driven by demand from cost-conscious buyers and reduced availability as recyclers upgrade inventory to Grade A when possible.
Grade C Pallets (Economy Quality)
2026: Average $6.89 | Median $6.06 | Range $4.00-$32.85
| Year | Average | Change |
|---|---|---|
| 2023 | $2.61 | — |
| 2024 | $4.10 | +57.1% |
| 2025 | $5.98 | +45.9% |
| 2026 | $6.89 | +15.2% |
| 3-Year | — | +164.0% |
Grade C pricing shows elevated volatility, with extreme outliers in states like West Virginia ($32.85) skewing the range. Median pricing provides a more reliable benchmark at $6.06.
Pallet Cores (Damaged/Repairable)
2026: Average $2.75 | Median $2.42 | Range $1.60-$12.84
| Year | Average | Change |
|---|---|---|
| 2023 | $1.18 | — |
| 2024 | $1.50 | +27.1% |
| 2025 | $2.40 | +60.0% |
| 2026 | $2.75 | +14.6% |
| 3-Year | — | +133.1% |
Core prices have more than doubled since 2023 as recyclers compete for raw material to meet growing demand. This represents opportunity for businesses with pallet waste streams.
Interactive Price Map
Explore pallet prices across all 50 states. Select a grade to see pricing and click any state for detailed information.
Regional Analysis
Northeast Region
| Grade | Average | Median | Range |
|---|---|---|---|
| Grade A | $10.36 | $8.18 | $5.10-$24.00 |
| Grade B | $6.99 | $5.92 | $4.05-$10.89 |
| Grade C | $6.16 | $6.73 | $4.00-$8.13 |
| Cores | $2.45 | $2.62 | $1.60-$3.29 |
Regional Trends (Grade A):
The Northeast maintains the highest pricing nationally. Rhode Island ($24.00 Grade A) and Maine ($20.40) lead due to limited local suppliers and high transportation costs from southern lumber sources.
| State | Grade A | Grade B | Grade C | Cores |
|---|---|---|---|---|
| Rhode Island | $24.00 | $10.40 | $8.13 | $3.29 |
| Maine | $20.40 | $9.38 | $6.63 | $2.62 |
| New Hampshire | $9.66 | $8.56 | $5.83 | $2.37 |
| Massachusetts | $8.80 | $4.80 | $7.12 | $2.88 |
| Vermont | $8.58 | $5.39 | $4.68 | $1.88 |
| Delaware | $8.18 | $6.82 | $6.82 | $2.72 |
| New York | $7.93 | $5.03 | $5.13 | $2.02 |
| New Jersey | $7.73 | $5.66 | $5.25 | $2.10 |
| Pennsylvania | $7.25 | $10.89 | $4.00 | $1.60 |
| Connecticut | $6.30 | $5.92 | $6.73 | $2.74 |
| Maryland | $5.10 | $4.05 | $6.84 | $2.73 |
West Region
| Grade | Average | Median | Range |
|---|---|---|---|
| Grade A | $10.72 | $10.26 | $6.17-$19.20 |
| Grade B | $7.13 | $7.54 | $4.63-$9.00 |
| Grade C | $6.64 | $6.03 | $4.41-$8.17 |
| Cores | $2.85 | $2.44 | $1.77-$8.25 |
Regional Trends (Grade A):
The West shows high variability with Nevada ($19.20) and Hawaii ($14.82) commanding premium pricing while Oregon ($6.17) offers competitive rates.
| State | Grade A | Grade B | Grade C | Cores |
|---|---|---|---|---|
| Nevada | $19.20 | $7.87 | $6.10 | $2.44 |
| Hawaii | $14.82 | $8.44 | $8.17 | $3.35 |
| Wyoming | $14.55 | $9.00 | $7.09 | $2.87 |
| Alaska | $10.50 | $4.63 | $21.26 | $8.25 |
| Montana | $10.40 | $7.96 | $5.86 | $2.30 |
| Idaho | $10.26 | $8.66 | $7.98 | $3.19 |
| Utah | $9.34 | $7.54 | $6.46 | $2.56 |
| Colorado | $8.16 | $5.25 | $6.03 | $2.40 |
| California | $7.72 | $6.52 | $5.99 | $2.38 |
| Washington | $6.76 | $7.46 | $4.41 | $1.77 |
| Oregon | $6.17 | $5.14 | $5.62 | $2.29 |
Southeast Region
| Grade | Average | Median | Range |
|---|---|---|---|
| Grade A | $8.48 | $7.97 | $5.46-$16.00 |
| Grade B | $6.29 | $5.22 | $4.23-$15.60 |
| Grade C | $6.50 | $5.68 | $4.59-$32.85 |
| Cores | $3.37 | $2.30 | $1.83-$12.84 |
Regional Trends (Grade A):
The Southeast benefits from proximity to lumber production but West Virginia's isolated geography drives extreme pricing outliers.
| State | Grade A | Grade B | Grade C | Cores |
|---|---|---|---|---|
| West Virginia | $16.00 | $15.60 | $32.85 | $12.84 |
| Mississippi | $9.66 | $6.96 | $6.51 | $2.59 |
| South Carolina | $9.42 | $6.84 | $5.57 | $2.24 |
| North Carolina | $8.50 | $5.49 | $4.59 | $1.83 |
| Kentucky | $8.34 | $5.10 | $5.78 | $2.35 |
| Virginia | $7.60 | $4.50 | $4.96 | $1.99 |
| Florida | $7.10 | $4.34 | $5.29 | $2.13 |
| Georgia | $6.89 | $5.35 | $7.41 | $2.99 |
| Alabama | $5.82 | $4.23 | $4.89 | $1.92 |
| Tennessee | $5.46 | $4.44 | $6.46 | $2.55 |
Midwest Region
| Grade | Average | Median | Range |
|---|---|---|---|
| Grade A | $8.40 | $7.48 | $4.62-$22.42 |
| Grade B | $6.46 | $6.12 | $3.63-$13.20 |
| Grade C | $6.21 | $6.16 | $4.87-$8.06 |
| Cores | $2.51 | $2.48 | $1.97-$3.23 |
Regional Trends (Grade A):
The Midwest offers consistent pricing with strong recycling infrastructure. South Dakota ($22.42) is an outlier driven by agricultural demand and limited local suppliers.
| State | Grade A | Grade B | Grade C | Cores |
|---|---|---|---|---|
| South Dakota | $22.42 | $13.20 | $7.06 | $2.83 |
| Iowa | $8.97 | $6.82 | $5.85 | $2.30 |
| Wisconsin | $8.70 | $8.35 | $6.23 | $2.53 |
| Nebraska | $8.11 | $6.76 | $6.76 | $2.69 |
| North Dakota | $7.98 | $6.65 | $6.65 | $2.69 |
| Indiana | $7.89 | $3.97 | $6.73 | $2.72 |
| Illinois | $7.08 | $8.15 | $4.87 | $1.97 |
| Missouri | $7.08 | $4.80 | $6.09 | $2.44 |
| Ohio | $6.70 | $4.82 | $5.48 | $2.23 |
| Minnesota | $6.06 | $3.63 | $5.38 | $2.15 |
| Kansas | $5.22 | $4.80 | $5.78 | $2.27 |
| Michigan | $4.62 | $5.59 | $8.06 | $3.23 |
Southwest Region
| Grade | Average | Median | Range |
|---|---|---|---|
| Grade A | $5.79 | $5.81 | $4.71-$6.70 |
| Grade B | $7.54 | $5.07 | $4.05-$16.80 |
| Grade C | $5.54 | $5.60 | $4.36-$6.66 |
| Cores | $2.23 | $2.26 | $1.76-$2.71 |
Regional Trends (Grade A):
The Southwest offers the most competitive Grade A pricing nationally, led by Texas's massive pallet recycling industry. Louisiana shows anomalous Grade B pricing ($16.80) requiring further market investigation.
| State | Grade A | Grade B | Grade C | Cores |
|---|---|---|---|---|
| Texas | $6.70 | $5.04 | $4.90 | $1.97 |
| Louisiana | $6.30 | $16.80 | $5.49 | $2.25 |
| Arkansas | $5.92 | $5.10 | $5.71 | $2.25 |
| Arizona | $5.70 | $4.65 | $6.13 | $2.43 |
| New Mexico | $5.38 | $4.05 | $6.66 | $2.71 |
| Oklahoma | $4.71 | $9.60 | $4.36 | $1.76 |
Price Trend Summary (2023-2026)
| Grade | 2023 | 2024 | 2025 | 2026 | Δ 23→24 | Δ 24→25 | Δ 25→26 | Δ 23→26 |
|---|---|---|---|---|---|---|---|---|
| Grade A | $5.86 | $6.16 | $8.33 | $9.04 | +5.1% | +35.2% | +8.5% | +54.3% |
| Grade B | $3.79 | $4.14 | $6.24 | $6.82 | +9.2% | +50.7% | +9.3% | +79.9% |
| Grade C | $2.61 | $4.10 | $5.98 | $6.89 | +57.1% | +45.9% | +15.2% | +164.0% |
| Cores | $1.18 | $1.50 | $2.40 | $2.75 | +27.1% | +60.0% | +14.6% | +133.1% |
The data shows consistent upward pressure across all grades, with the most significant increases in lower-quality grades as recyclers compete for supply. The 3-year trend shows Grade A up +54.3%, Grade B up +79.9%, and Cores up +133.1% since the 2023 market correction.
Market Outlook
The 2026 pallet market reflects several converging trends:
Supply Factors: Lumber prices remain elevated compared to pre-pandemic levels. Labor costs continue rising across the recycling industry. Large consolidators are acquiring independent operators, reducing competition in some markets.
Demand Factors: E-commerce growth sustains strong pallet demand. Manufacturing reshoring increases domestic pallet consumption. Environmental regulations favor recycled pallets over new production.
Recommendations for Buyers: Establish relationships with multiple suppliers to ensure supply continuity. Consider regional sourcing—buying from lower-cost states can yield 30-40% savings. Lock in pricing with volume commitments where possible.
Recommendations for Sellers: Focus on quality differentiation to command premium pricing. Develop relationships with high-volume buyers for consistent demand. Monitor core pricing—selling damaged pallets to recyclers offers better returns than ever.
Methodology
Data compiled from verified supplier listings on UsedPalletRecycling.com classified ads platform. All prices reflect wholesale rates for standard 48x40 GMA stringer pallets. Regional averages calculated from state-level data weighted by listing volume.